|
|

|
|
TROPICAL RAINFORESTS:
GHG emissions charts
|
|
National greenhouse gas emissions from energy use and deforestation
National GHG Emissions (CO2, CH4, N2O, PFCs, HFCs, SF6) for 2000, the most recent year for which global emissions data is available for Land Use, Land-Use Change and Forestry (LULUCF).
More current data on national emissions from fossil fuels can be found at the Carbon Dioxide Information Analysis Center (CDIAC).
The following charts are derived from data available at WRI's Climate Analysis Indicators Tool (CAIT). Thank you to Kevin Gurney of Purdue University for his assistance.
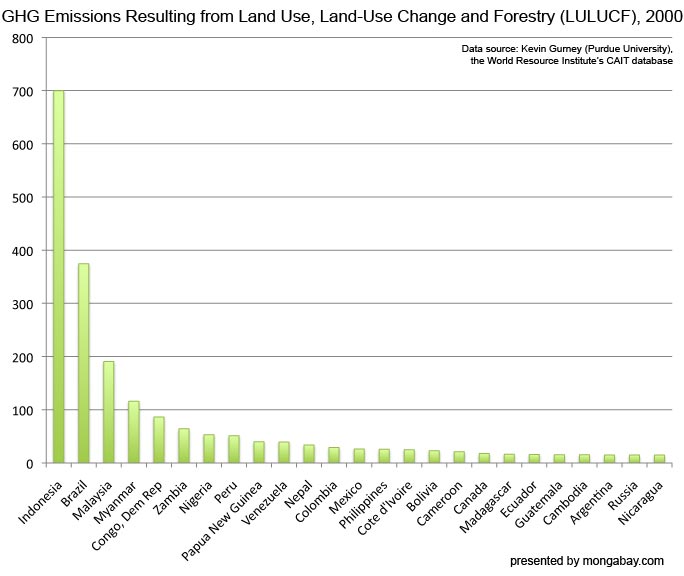
Greenhouse gas emissions resulting from Land Use, Land-Use Change and Forestry (LULUCF). LULUCF includes deforestation and forest degradation. The REDD mechanism seeks to reduce these emissions by compensating tropical countries for conserving their forests.
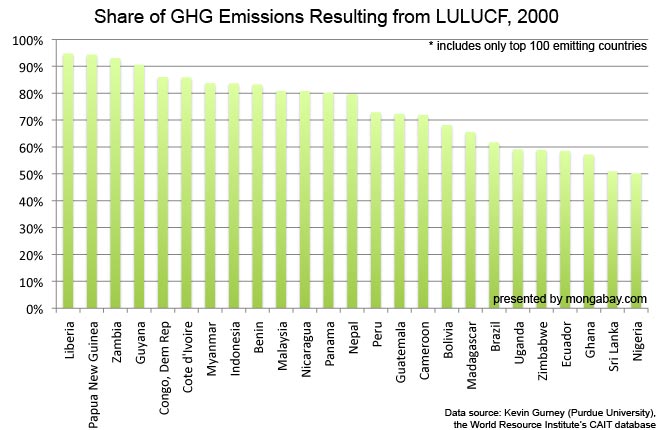
Share of GHG emissions resulting from LULUCF in the year 2000. This chart includes on the 100 top emitting countries.
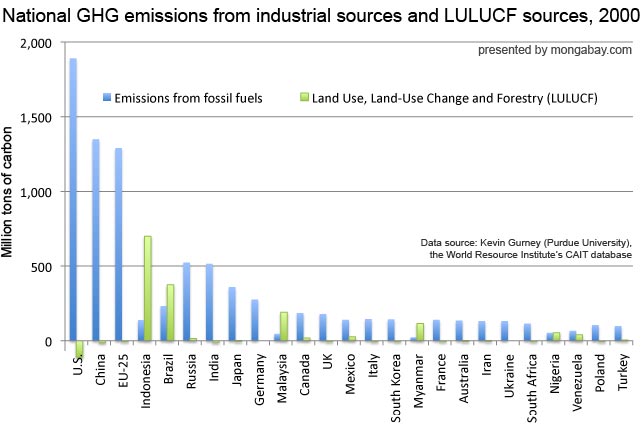
National GHG emissions from industrial sources (electricity generation, transportation, buildings, etc) and LULUCF, 2000. Note that some countries have negative emissions from LULUCF meaning they these sources are a net carbon sink. Also note that the E.U. is listed in addition to its individual member countries. Removing the E.U. from the chart results in the following change:
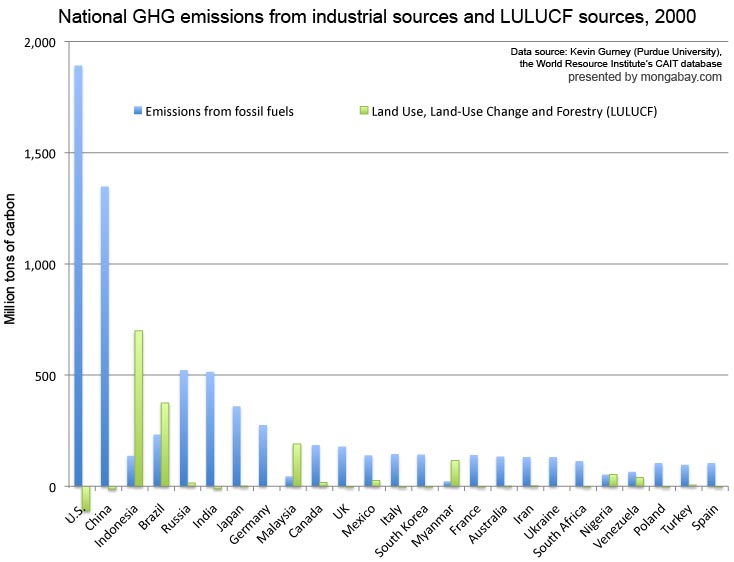
TABLE OF EMISSIONS, BY COUNTRY FOR 2000
| Emissions from non-LULUFC sources | Emissions from LULUCF sources | Total GHG Emissions | |
| Country | MtC | Rank | MtC | Rank | MtC | Rank | "Percent
LULUCF" |
| U.S. | 1,891 | 1 | -110 | | 1,781 | 1 | -6.2% |
| China | 1,348 | 2 | -13 | | 1,335 | 2 | -1.0% |
| EU-25 | 1,290 | 3 | -6 | | 1,284 | 3 | -0.4% |
| Indonesia | 137 | 15 | 700 | | 837 | 4 | 83.6% |
| Brazil | 232 | 8 | 375 | | 607 | 5 | 61.7% |
| Russia | 523 | 4 | 15 | | 538 | 6 | 2.8% |
| India | 514 | 5 | -11 | | 503 | 7 | -2.2% |
| Japan | 359 | 6 | 1 | | 361 | 8 | 0.3% |
| Germany | 276 | 7 | 0 | | 276 | 9 | 0.0% |
| Malaysia | 45 | 33 | 191 | | 236 | 10 | 80.8% |
| Canada | 186 | 9 | 18 | | 203 | 11 | 8.7% |
| UK | 178 | 10 | 0 | | 178 | 12 | -0.2% |
| Mexico | 140 | 14 | 26 | | 166 | 13 | 15.9% |
| Italy | 145 | 11 | -1 | | 144 | 14 | -0.6% |
| South Korea | 142 | 12 | 0 | | 143 | 15 | 0.2% |
| Myanmar | 23 | 48 | 116 | | 139 | 16 | 83.7% |
| France | 140 | 13 | -2 | | 138 | 17 | -1.2% |
| Australia | 134 | 16 | 1 | | 135 | 18 | 0.8% |
| Iran | 131 | 18 | 2 | | 133 | 19 | 1.7% |
| Ukraine | 132 | 17 | 0 | | 132 | 20 | 0.0% |
| South Africa | 114 | 19 | 1 | | 114 | 21 | 0.4% |
| Nigeria | 53 | 30 | 53 | | 106 | 22 | 50.2% |
| Venezuela | 65 | 27 | 39 | | 105 | 23 | 37.5% |
| Poland | 104 | 21 | -1 | | 103 | 24 | -0.5% |
| Turkey | 97 | 22 | 6 | | 103 | 25 | 5.6% |
| Spain | 104 | 20 | -2.4 | | 101.6 | 26 | -2.4% |
| Congo, Dem. Rep | 14.1 | 75 | 86.6 | | 100.7 | 27 | 86.0% |
| Argentina | 79 | 24 | 15 | | 94 | 28 | 16.0% |
| Saudi Arabia | 93 | 23 | 0 | | 93 | 29 | 0.0% |
| Pakistan | 77.9 | 25 | 9 | | 86.9 | 30 | 10.4% |
| Thailand | 72.2 | 26 | 13 | | 85.2 | 31 | 15.3% |
| Colombia | 43.7 | 35 | 29 | | 72.7 | 32 | 39.9% |
| Peru | 19 | 56 | 51.1 | | 70.1 | 33 | 72.9% |
| Zambia | 4.8 | 109 | 64.3 | | 69.1 | 34 | 93.1% |
| Taiwan | 62.9 | 28 | 0 | | 62.9 | 35 | 0.0% |
| Philippines | 36.3 | 39 | 25.9 | | 62.2 | 36 | 41.6% |
| Netherlands | 58.7 | 29 | 0 | | 58.7 | 37 | 0.0% |
| Uzbekistan | 49.4 | 31 | 0 | | 49.4 | 38 | 0.0% |
| Egypt | 48.5 | 32 | 0.8 | | 49.3 | 39 | 1.6% |
| Kazakhstan | 43.9 | 34 | 0 | | 43.9 | 40 | 0.0% |
| Nepal | 8.6 | 84 | 33.7 | | 42.3 | 41 | 79.7% |
| Papua New Guinea | 2.4 | 133 | 39.9 | | 42.3 | 42 | 94.3% |
| Belgium | 40.4 | 36 | 0 | | 40.4 | 43 | 0.0% |
| Czech Republic | 39 | 37 | 0 | | 39 | 44 | 0.0% |
| Algeria | 34.4 | 40 | 0.8 | | 35.2 | 45 | 2.3% |
| Sudan | 26.3 | 47 | 8.3 | | 34.6 | 46 | 24.0% |
| Cambodia | 18.7 | 58 | 15.3 | | 34 | 47 | 45.0% |
| Romania | 34 | 41 | -0.4 | | 33.6 | 48 | -1.2% |
| Bolivia | 10.7 | 81 | 22.9 | | 33.6 | 49 | 68.2% |
| United Arab Emirates | 32 | 44 | 0 | | 32 | 50 | 0.0% |
| Greece | 32.8 | 43 | -0.9 | | 31.9 | 51 | -2.8% |
| Bangladesh | 33.4 | 42 | -2.5 | | 30.9 | 52 | -8.1% |
| Korea (North) | 30.5 | 45 | 0.3 | | 30.8 | 53 | 1.0% |
| Cameroon | 8.2 | 88 | 21 | | 29.2 | 54 | 71.9% |
| Cote d'Ivoire | 4.1 | 113 | 24.9 | | 29 | 55 | 85.9% |
| Iraq | 27.5 | 46 | 0.1 | | 27.6 | 56 | 0.4% |
| Ecuador | 11.4 | 79 | 16.1 | | 27.5 | 57 | 58.5% |
| Chile | 20.9 | 53 | 4.2 | | 25.1 | 58 | 16.7% |
| Madagascar | 8.6 | 85 | 16.4 | | 25 | 59 | 65.6% |
| Vietnam | 36.6 | 38 | -13.3 | | 23.3 | 60 | -57.1% |
| Belarus | 21.5 | 51 | 1.5 | | 23 | 61 | 6.5% |
| Zimbabwe | 9 | 83 | 12.9 | | 21.9 | 62 | 58.9% |
| Austria | 21.9 | 49 | -0.2 | | 21.7 | 63 | -0.9% |
| Guatemala | 5.9 | 102 | 15.4 | | 21.3 | 64 | 72.3% |
| Israel | 21.1 | 52 | 0 | | 21.1 | 65 | 0.0% |
| New Zealand | 19.9 | 55 | 0.9 | | 20.8 | 66 | 4.3% |
| Hungary | 20.7 | 54 | -0.2 | | 20.5 | 67 | -1.0% |
| Tanzania | 16.1 | 68 | 4 | | 20.1 | 68 | 19.9% |
| Portugal | 21.6 | 50 | -1.6 | | 20 | 69 | -8.0% |
| Kuwait | 18.9 | 57 | 0 | | 18.9 | 70 | 0.0% |
| Finland | 18.7 | 59 | -0.2 | | 18.5 | 71 | -1.1% |
| Ethiopia | 16.1 | 69 | 2.3 | | 18.4 | 72 | 12.5% |
| Syria | 18.2 | 60 | 0 | | 18.2 | 73 | 0.0% |
| Nicaragua | 3.5 | 119 | 14.7 | | 18.2 | 74 | 80.8% |
| Denmark | 18.1 | 61 | 0 | | 18.1 | 75 | 0.0% |
| Uganda | 7.4 | 92 | 10.7 | | 18.1 | 76 | 59.1% |
| Kenya | 14.4 | 74 | 3.2 | | 17.6 | 77 | 18.2% |
| Ireland | 18 | 62 | -0.5 | | 17.5 | 78 | -2.9% |
| Turkmenistan | 17.5 | 63 | 0 | | 17.5 | 79 | 0.0% |
| Libya | 16.9 | 65 | 0.2 | | 17.1 | 80 | 1.2% |
| Sweden | 16.9 | 64 | 0 | | 16.9 | 81 | 0.0% |
| Serbia & Montenegro | 16.5 | 67 | 0 | | 16.5 | 82 | 0.0% |
| Bulgaria | 16.9 | 66 | -0.6 | | 16.3 | 84 | -3.7% |
| Morocco | 15.6 | 70 | 0.7 | | 16.3 | 83 | 4.3% |
| Panama | 3.2 | 122 | 13 | | 16.2 | 85 | 80.2% |
| Sri Lanka | 7.7 | 90 | 8 | | 15.7 | 86 | 51.0% |
| Singapore | 15.2 | 71 | 0 | | 15.2 | 87 | 0.0% |
| Azerbaijan | 15.1 | 72 | 0 | | 15.1 | 88 | 0.0% |
| Angola | 9.2 | 82 | 4.9 | | 14.1 | 89 | 34.8% |
| Switzerland | 14.1 | 76 | -0.1 | | 14 | 90 | -0.7% |
| Norway | 14.7 | 73 | -0.9 | | 13.8 | 91 | -6.5% |
| Ghana | 5.7 | 104 | 7.6 | | 13.3 | 92 | 57.1% |
| Slovakia | 12.4 | 78 | 0.8 | | 13.2 | 93 | 6.1% |
| Paraguay | 7.1 | 93 | 5.7 | | 12.8 | 94 | 44.5% |
| Benin | 2 | 137 | 9.9 | | 11.9 | 95 | 83.2% |
| Liberia | 0.6 | 158 | 10.8 | | 11.4 | 96 | 94.7% |
| Cuba | 13.7 | 77 | -2.5 | | 11.2 | 97 | -22.3% |
| Qatar | 10.8 | 80 | 0 | | 10.8 | 98 | 0.0% |
| Guyana | 1 | 147 | 9.6 | | 10.6 | 99 | 90.6% |
| Botswana | 4.2 | 112 | 5.4 | | 9.6 | 100 | 56.3% |
| Tunisia | 8.4 | 87 | 1 | | 9.4 | 101 | 10.6% |
| Mali | 6.9 | 97 | 2.2 | | 9.1 | 102 | 24.2% |
| Malawi | 1.8 | 143 | 7.3 | | 9.1 | 103 | 80.2% |
| Afghanistan | 6.1 | 101 | 2.4 | | 8.5 | 105 | 28.2% |
| Honduras | 3.7 | 117 | 4.8 | | 8.5 | 104 | 56.5% |
| Dominican Republic | 8.4 | 86 | 0 | | 8.4 | 107 | 0.0% |
| Laos | 2 | 139 | 6.4 | | 8.4 | 106 | 76.2% |
| Oman | 8 | 89 | 0 | | 8 | 108 | 0.0% |
| Mongolia | 7.6 | 91 | 0.1 | | 7.7 | 109 | 1.3% |
| Croatia | 7.1 | 94 | 0 | | 7.1 | 110 | 0.0% |
| Yemen | 6.9 | 96 | 0.1 | | 7 | 111 | 1.4% |
| Trinidad & Tobago | 6.8 | 98 | 0 | | 6.8 | 113 | 0.0% |
| Estonia | 6.2 | 100 | 0.6 | | 6.8 | 112 | 8.8% |
| Mozambique | 4.1 | 115 | 2.5 | | 6.6 | 114 | 37.9% |
| Jordan | 6.5 | 99 | 0 | | 6.5 | 115 | 0.0% |
| Belize | 0.3 | 166 | 5.9 | | 6.2 | 116 | 95.2% |
| Senegal | 5.2 | 106 | 0.9 | | 6.1 | 117 | 14.8% |
| Costa Rica | 3.4 | 120 | 2.7 | | 6.1 | 118 | 44.3% |
| Burkina Faso | 5.7 | 103 | 0.2 | | 5.9 | 119 | 3.4% |
| Chad | 4.8 | 108 | 1 | | 5.8 | 120 | 17.2% |
| Central African Republic | 3.1 | 123 | 2.5 | | 5.6 | 121 | 44.6% |
| Slovenia | 5.2 | 105 | 0.3 | | 5.5 | 122 | 5.5% |
| Guinea | 2.5 | 132 | 2.9 | | 5.4 | 123 | 53.7% |
| Lebanon | 4.9 | 107 | 0.2 | | 5.1 | 124 | 3.9% |
| Lithuania | 4.1 | 114 | 0.8 | | 4.9 | 125 | 16.3% |
| Sierra Leone | 1.1 | 146 | 3.6 | | 4.7 | 126 | 76.6% |
| Congo | 1.9 | 141 | 2.7 | | 4.6 | 127 | 58.7% |
| Bahrain | 4.5 | 110 | 0 | | 4.5 | 128 | 0.0% |
| Bosnia & Herzegovina | 4.5 | 111 | 0 | | 4.5 | 129 | 0.0% |
| Jamaica | 3.5 | 118 | 0.8 | | 4.3 | 130 | 18.6% |
| El Salvador | 3.1 | 124 | 1.1 | | 4.2 | 131 | 26.2% |
| Togo | 1.6 | 144 | 2.4 | | 4 | 132 | 60.0% |
| Mauritania | 3.7 | 116 | 0 | | 3.7 | 133 | 0.0% |
| Gabon | 2.7 | 129 | 1 | | 3.7 | 134 | 27.0% |
| Latvia | 2.6 | 130 | 1.1 | | 3.7 | 135 | 29.7% |
| Niger | 3.3 | 121 | 0.2 | | 3.5 | 136 | 5.7% |
| Namibia | 2.8 | 127 | 0.6 | | 3.4 | 137 | 17.6% |
| Macedonia, FYR | 3.1 | 125 | 0 | | 3.1 | 139 | 0.0% |
| Rwanda | 1 | 148 | 2.1 | | 3.1 | 138 | 67.7% |
| Moldova | 3 | 126 | 0 | | 3 | 140 | 0.0% |
| Georgia | 2.8 | 128 | 0 | | 2.8 | 142 | 0.0% |
| Burundi | 0.9 | 153 | 1.9 | | 2.8 | 141 | 67.9% |
| Haiti | 2 | 136 | 0.6 | | 2.6 | 143 | 23.1% |
| Luxembourg | 2.5 | 131 | 0 | | 2.5 | 144 | 0.0% |
| Cyprus | 2.2 | 135 | 0 | | 2.2 | 146 | 0.0% |
| Tajikistan | 2.2 | 134 | 0 | | 2.2 | 145 | 0.0% |
| Brunei | 2 | 138 | 0 | | 2 | 147 | 0.0% |
| Kyrgyzstan | 1.9 | 140 | 0 | | 1.9 | 148 | 0.0% |
| Equatorial Guinea | 0.7 | 156 | 1.2 | | 1.9 | 149 | 63.2% |
| Armenia | 1.8 | 142 | 0 | | 1.8 | 150 | 0.0% |
| Albania | 1 | 149 | 0.2 | | 1.2 | 151 | 16.7% |
| Mauritius | 1.1 | 145 | 0 | | 1.1 | 152 | 0.0% |
| Fiji | 0.9 | 151 | 0 | | 0.9 | 153 | 0.0% |
| Suriname | 0.9 | 150 | 0 | | 0.9 | 154 | 0.0% |
| Iceland | 0.8 | 155 | 0 | | 0.8 | 157 | 0.0% |
| Lesotho | 0.8 | 154 | 0 | | 0.8 | 156 | 0.0% |
| Guinea-Bissau | 0.5 | 161 | 0.3 | | 0.8 | 155 | 37.5% |
| Bahamas | 0.6 | 159 | 0 | | 0.6 | 159 | 0.0% |
| Malta | 0.6 | 157 | 0 | | 0.6 | 158 | 0.0% |
| Bhutan | 0.5 | 160 | 0 | | 0.5 | 160 | 0.0% |
| Djibouti | 0.5 | 162 | 0 | | 0.5 | 161 | 0.0% |
| Swaziland | 0.9 | 152 | -0.5 | | 0.4 | 163 | -125.0% |
| Antigua & Barbuda | 0.4 | 165 | 0 | | 0.4 | 164 | 0.0% |
| Barbados | 0.4 | 163 | 0 | | 0.4 | 162 | 0.0% |
| Uruguay | 7 | 95 | -6.7 | | 0.3 | 166 | -2233.3% |
| Gambia | 0.4 | 164 | -0.1 | | 0.3 | 165 | -33.3% |
| Eritrea | 0.2 | 169 | 0 | | 0.2 | 169 | 0.0% |
| Maldives | 0.2 | 170 | 0 | | 0.2 | 171 | 0.0% |
| Seychelles | 0.2 | 168 | 0 | | 0.2 | 168 | 0.0% |
| Vanuatu | 0.2 | 167 | 0 | | 0.2 | 167 | 0.0% |
| Solomon Islands | 0.1 | 172 | 0.1 | | 0.2 | 170 | 50.0% |
| Comoros | 0.1 | 173 | 0 | | 0.1 | 173 | 0.0% |
| Dominica | 0.1 | 178 | 0 | | 0.1 | 178 | 0.0% |
| Grenada | 0.1 | 174 | 0 | | 0.1 | 174 | 0.0% |
| Palau | 0.1 | 176 | 0 | | 0.1 | 176 | 0.0% |
| Saint Lucia | 0.1 | 171 | 0 | | 0.1 | 172 | 0.0% |
| Saint Vincent & Grenadines | 0.1 | 177 | 0 | | 0.1 | 177 | 0.0% |
| Tonga | 0.1 | 175 | 0 | | 0.1 | 175 | 0.0% |
| Cape Verde | 0 | 180 | 0 | | 0 | 181 | n/a |
| Cook Islands | 0 | 185 | 0 | | 0 | 185 | n/a |
| Kiribati | 0 | 184 | 0 | | 0 | 184 | n/a |
| Nauru | 0 | 179 | 0 | | 0 | 180 | n/a |
| Niue | 0 | 186 | 0 | | 0 | 186 | n/a |
| Saint Kitts & Nevis | 0 | 182 | 0 | | 0 | 182 | n/a |
| Samoa | 0 | 180 | 0 | | 0 | 179 | n/a |
| Sao Tome & Principe | 0 | 183 | 0 | | 0 | 183 | n/a |
|
More rainforest news
|
|
|
|
